How to analyze music structure using AI visualization tools
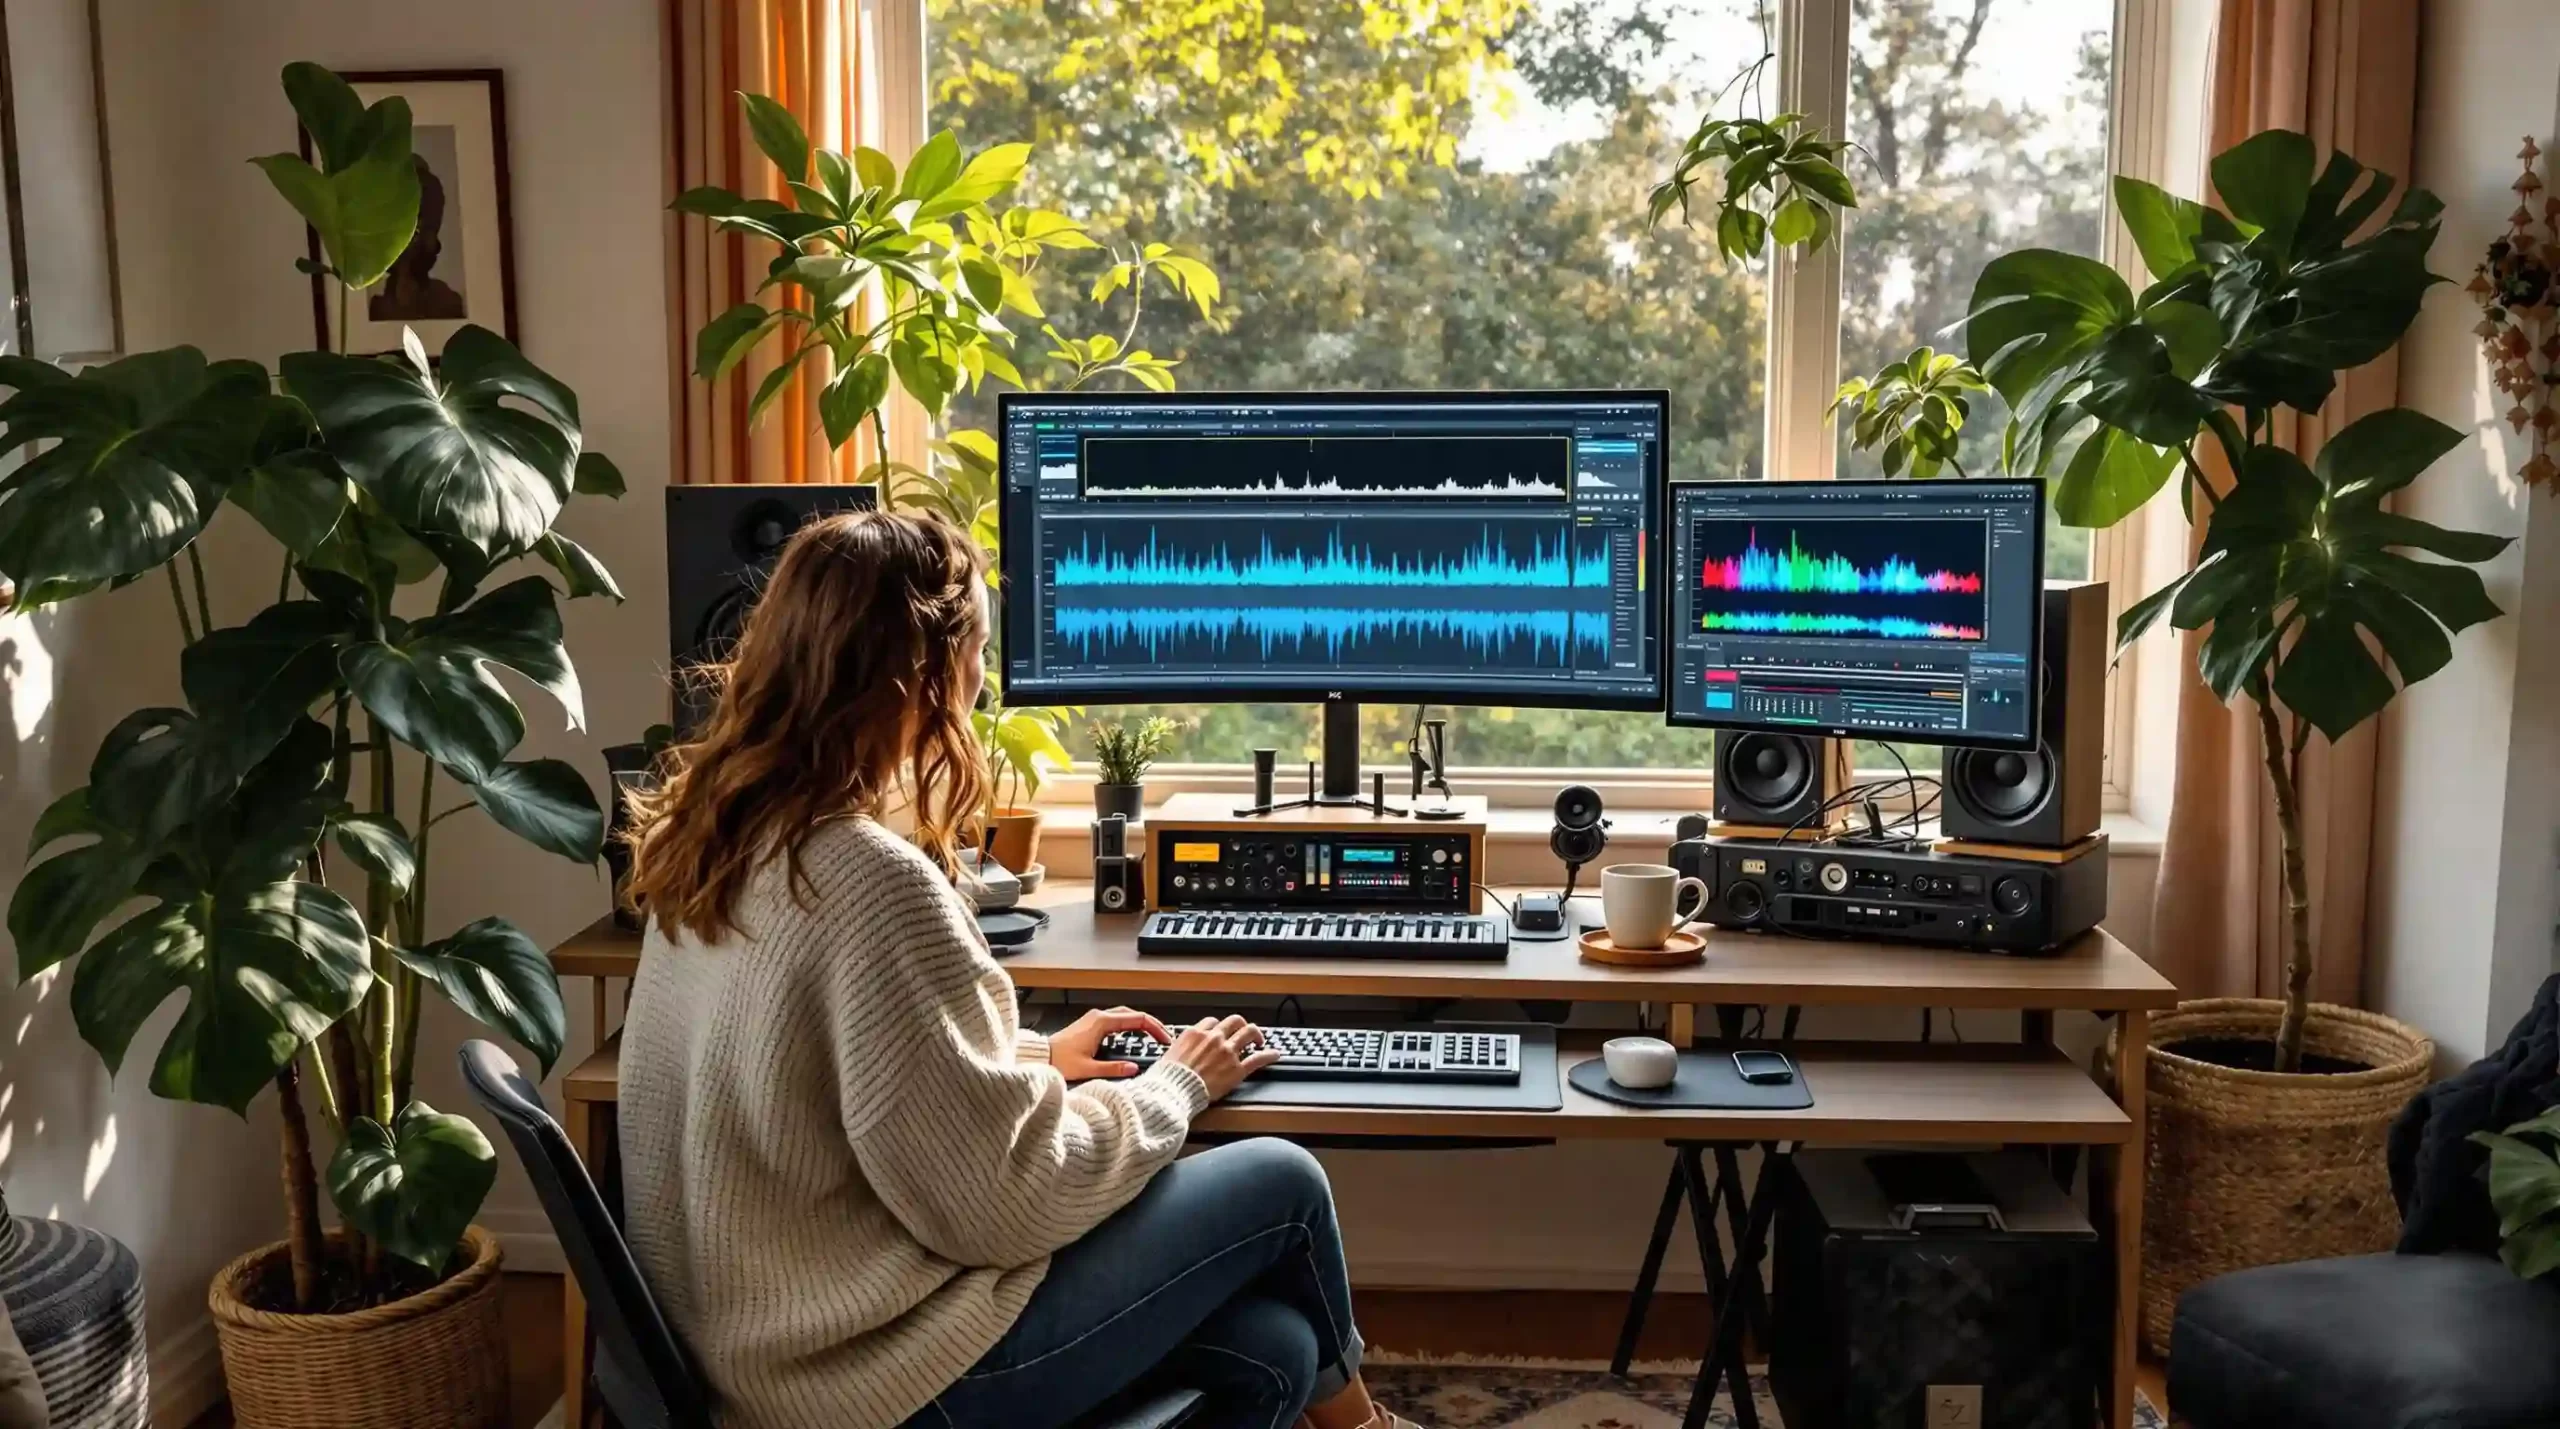
AI visualization tools play a vital role in music analysis. They help us understand music structure through visual representations, making complex data more accessible. These tools use advanced algorithms to interpret various musical elements, including:
- Rhythm
- Harmony
- Timbre
Analyzing music structure using AI visualization tools involves several key techniques and steps:
- Selecting the right tool based on your analysis needs.
- Importing audio data into the chosen software.
- Utilizing visualization methods like Fourier transforms or Mel spectrograms to examine audio signals.
By leveraging these techniques, musicians, producers, and researchers can gain deeper insights into compositions, enhancing their understanding of various musical characteristics.
Scott Evans DJ is supported by its readers. If you purchase through any link on the site, we may earn a commission. Learn more
The best AI tools for data Visualization and Music Analysis

AI visualization tools play a crucial role in music analysis. They enable detailed examinations of musical elements such as:
- Rhythm: The timing and pattern of sounds.
- Harmony: The combination of different musical notes played simultaneously.
- Timbre: The unique quality or color of a sound.
These tools utilize advanced algorithms to transform audio data into visual formats. This transformation makes it easier for users to identify patterns, relationships, and anomalies that may not be apparent through traditional listening methods. Here’s a closer look at some popular AI visualization tools for music analysis:
Popular AI Visualization Tools
- Cyanite.ai: An AI-powered platform specializing in advanced visualization techniques.
- Offers automated analysis and tagging features.
- Users can upload music tracks to receive audio similarity, genre classification, and tempo insights.
- Integrates with various catalog systems while respecting diverse musical cultures.
- Sonic Visualiser: Widely used by researchers to explore audio recordings.
- Provides various visual representations, such as waveforms and spectrograms.
- Allows users to annotate audio, making it easier to highlight specific elements within a track.
- Supports plugins that extend its functionalities, enabling more complex analyses.
- Bridge.audio: Focuses on auto-tagging and categorizing tracks based on their features.
- Simplifies the process of organizing large music libraries through intelligent tagging systems.
- Librosa: A Python library designed to analyze audio and music.
- Offers tools for feature extraction, including tempo, pitch, and beat tracking.
- Ideal for those comfortable with coding who want customizable solutions.
- Torchaudio: Another Python library that integrates seamlessly with PyTorch.
- Facilitates preprocessing of audio data, making it suitable for machine learning applications.
These tools collectively enhance the understanding of music structure by providing accessible visual formats. Whether you’re a musician looking to dissect your compositions or a researcher analyzing historical recordings, these AI visualization tools equip you with the means to delve deeper into the world of music analysis.
Key Techniques in Music Structure Analysis

Visual representations play a crucial role in understanding music structure. They reveal patterns and relationships within audio recordings that might remain hidden through traditional listening methods. By converting sound into visual formats, one can easily identify elements such as rhythm, harmony, and dynamics.
Fourier Transforms
Fourier Transforms are a mathematical technique that converts audio signals from the time domain to the frequency domain. This method facilitates the identification of various frequency components present in a sound over time, making it useful for recognizing distinct musical notes and their harmonics, which are essential for structure analysis.
Mel Spectrograms
Mel Spectrograms are a specialized type of spectrogram that aligns frequencies with human auditory perception. This visualization technique displays sound frequencies on a scale that mirrors how we hear them, enhancing the analysis of melodies and harmonies. Mel Spectrograms are particularly effective in breaking down complex musical pieces into understandable segments.
Waveform Visualization
Waveform Visualization represents audio signals as a graph showing amplitude over time. This method provides insights into dynamics and loudness variations within a track, helping to spot peaks and troughs for easier identification of structural components like choruses or verses.
Spectrogram Analysis
Spectrogram Analysis offers a detailed view of sound across different frequencies at various points in time. This technique enables users to see how sounds evolve, making it easier to analyze transitions and changes within a piece. It is also useful for comparing different tracks or sections of a song to highlight similarities or differences.
Benefits of Using Visual Tools
Using visual tools in music structure analysis has several benefits:
- Simplifies complex data interpretation by presenting it visually.
- Aids musicians and researchers in uncovering hidden structures.
- Enhances collaborative efforts among musicians by providing common visual references.
Understanding these techniques allows for deeper engagement with music. Each method brings unique insights, transforming how we analyze compositions. As technology evolves, the integration of these visualization tools continues to enhance our approach to music analysis. The journey into music structure is enriched through these innovative techniques.
Step-by-Step Guide to Analyzing Music Structure Using AI Tools
Analyzing music structure with AI tools can be straightforward and rewarding. Follow these steps to make the most of your analysis.
1. Selecting the Right AI Tool
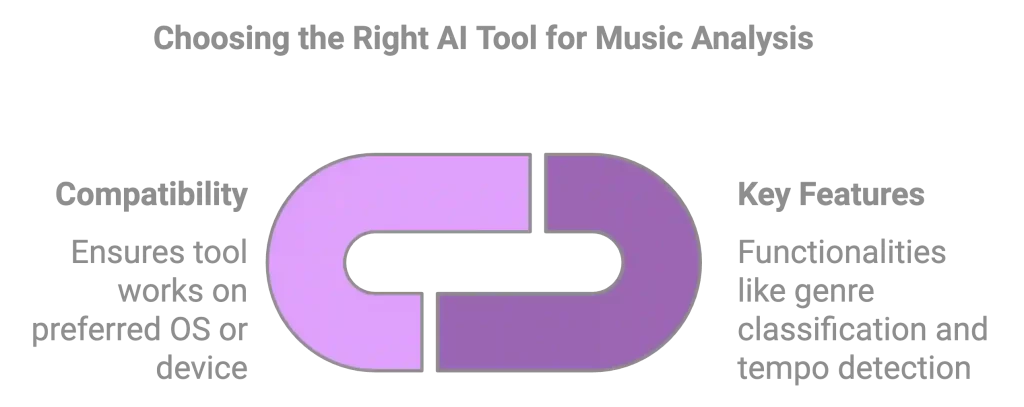
Choosing an appropriate AI visualization tool is crucial. Consider the following:
- Key Features: Look for functionalities that match your analysis needs, such as genre classification or tempo detection.
- Compatibility: Ensure the tool works on your preferred operating system (Windows, Mac, etc.) or device (desktop, mobile).
Popular options include:
- Cyanite.ai: Focuses on automated analysis and tagging.
- Bridge.audio: Known for its auto-tagging capabilities.
2. Importing Audio Data
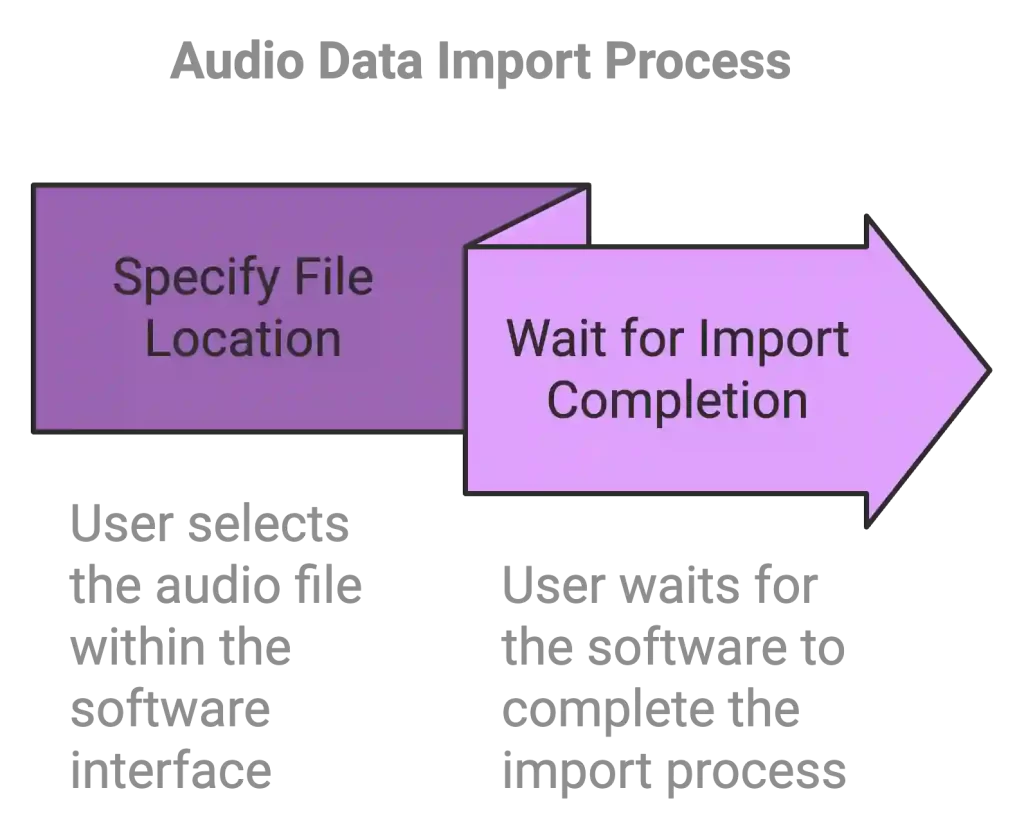
After selecting a tool, the next step involves uploading your audio data. This typically requires:
- Specifying the file location of your audio recording within the software interface.
- Waiting a few moments for the import process to complete; this may vary based on file size.
3. Utilizing Visualization Features for Analysis
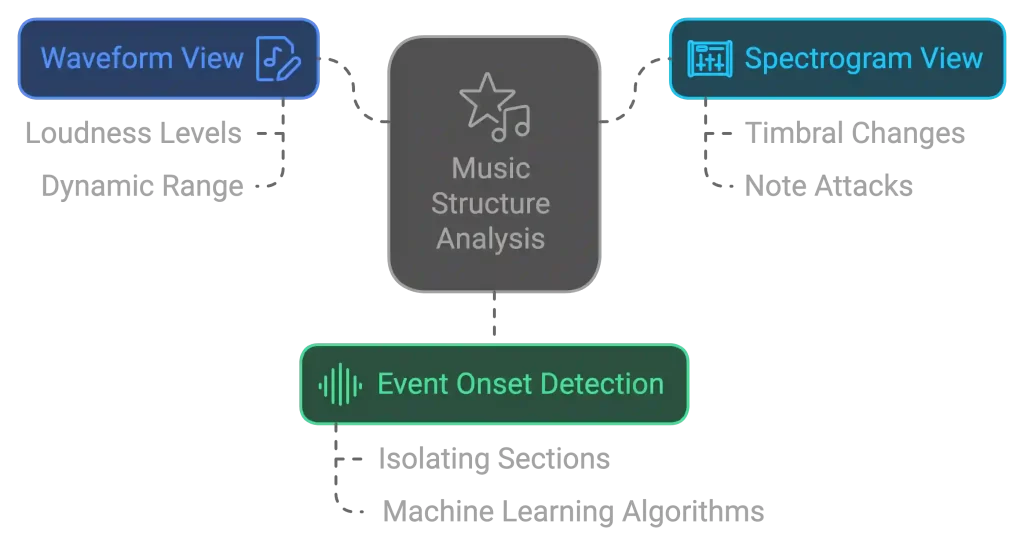
Most AI tools provide various visualization methods to analyze audio signals. Key visualizations include:
- Waveform View: Displays amplitude variations over time. Use this to gain insights into loudness levels and dynamic range.
- Spectrogram View: Illustrates how frequency content evolves. This view helps observe timbral changes or identify specific musical events like note attacks.
- Event Onset Detection: Some advanced tools employ machine learning algorithms that detect where individual sounds begin in an audio track, aiding in isolating sections of interest.
4. Interpreting Results and Insights
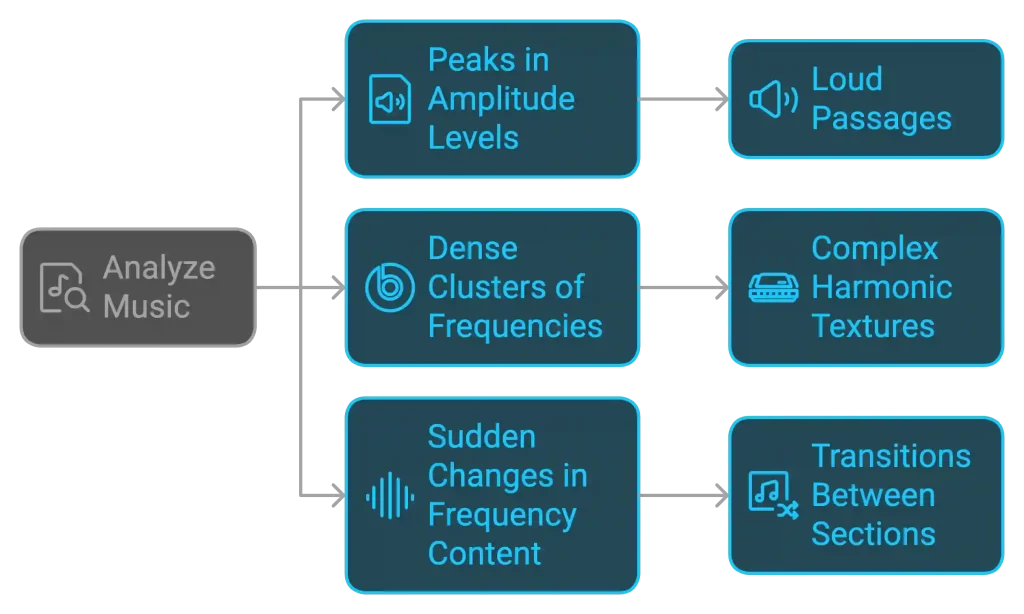
Once visualizations are generated, interpreting them becomes essential. Look for common patterns such as:
- Peaks in Amplitude Levels: Indicate loud passages or climaxes in the music.
- Dense Clusters of Frequencies: Suggest complex harmonic textures present in a piece.
- Sudden Changes in Frequency Content: Signal noteworthy transitions between different musical sections, like verses and choruses.
By following these steps, analyzing music structure using AI tools becomes an engaging exploration of sound that enhances understanding and appreciation of musical compositions.
Case Studies: Real-World Applications
The application of AI visualization tools in music analysis has gained traction in academic settings. A notable example is the Centre for Digital Music at Queen Mary University London. Researchers there have undertaken several studies that delve into how technology can reshape our understanding of music.
Focus Areas
Key areas of exploration include:
- Genre Classification: Using machine learning algorithms to categorize music based on its characteristics.
- Structural Analysis: Analyzing musical pieces to uncover their unique features and relationships.
Case Study: John Coltrane’s Blue Train
One significant study revolved around John Coltrane’s iconic album, Blue Train. Researchers utilized a combination of traditional listening techniques and advanced computational methods. This approach allowed them to explore:
- The album’s stylistic features
- Its impact on subsequent musicians and genres
- Patterns in harmony, rhythm, and timbre
By training machine learning algorithms on large datasets of annotated recordings, the researchers could identify distinct musical elements within the tracks. For instance:
- Chord Progressions: The analysis revealed intricate patterns that characterize Coltrane’s improvisational style.
- Rhythmic Structures: Visualization tools helped illustrate how varying rhythms contribute to the overall feel of each piece.
Insights Gained
The findings from this research enhanced understanding and sparked discussions about the evolution of jazz music. The intersection of traditional analysis with modern technology provided new perspectives on how musicians like Coltrane pushed boundaries.
Broader Implications
The work done by Marc R. Thompson and his team at the Centre for Digital Music exemplifies the potential of AI visualization tools. They demonstrate how these technologies can change our approach to studying music by:
- Making complex data more accessible
- Facilitating deeper insights into musical compositions
- Offering a fresh lens through which to appreciate historical works
Such studies reinforce the value of integrating technology into music analysis, paving the way for further exploration of various musical domains.
Benefits And Challenges Of Using AI Visualization Tools In Musicology Research

AI visualization tools bring several advantages to musicology research, enhancing how scholars analyze and interpret data. Here’s a closer look at their benefits:
1. Streamlined Qualitative Research
These tools automate tedious tasks like manual tagging and feature extraction from raw audio files. This efficiency allows researchers to focus more on drawing meaningful insights rather than getting bogged down in administrative details.
2. Enhanced Data Interpretation
AI can perform complex analyses that reveal patterns and relationships within musical compositions. Features like sentiment analysis offer a deeper understanding of emotional components in music.
3. Knowledge Graphs
Visualization tools often utilize knowledge graphs to illustrate connections between different musical elements. This representation aids researchers in exploring intricate relationships within large datasets.
4. Multilingual Support
While many tools primarily cater to English content, some are beginning to incorporate multilingual support, broadening their applicability across diverse musical cultures.
5. API Integration
Advanced API capabilities enable seamless workflow integration with popular software packages like Matlab. This feature enhances collaboration and flexibility in research methodologies.
Despite these advantages, challenges persist:
1. Limitations in Language Support
Many current AI tools struggle with non-English content during automated sentiment analysis. This limitation can lead to biased results and hinder comprehensive analysis of global music.
2. Dependence on Training Data
The effectiveness of AI algorithms relies heavily on the quality and breadth of training data. Inadequate datasets may restrict the tool’s ability to categorize or analyze certain musical styles or genres accurately.
3. Interpretation Challenges
Automated analyses can sometimes oversimplify complex musical structures. Researchers must be cautious in interpreting results, ensuring they validate findings through traditional methods when necessary.
In summary, while AI visualization tools present exciting opportunities for advancing musicology research, attention must be paid to their limitations. Continued development is essential, particularly in multilingual support and robust API integration, to fully harness their potential and enhance our understanding of music. Moreover, it’s crucial to acknowledge the potential pitfalls associated with over-reliance on these technologies, ensuring that they complement rather than replace traditional research methods.
Conclusion
Exploring AI visualization tools offers a unique opportunity to understand music structure in innovative ways. These tools provide valuable insights into various musical elements, making the analysis process more accessible and efficient.
Key Takeaways
- Diverse Tools Available: Many options exist for analyzing music structure with AI, each with its own features and functionalities.
- Critical Mindset: Approach findings critically. Technology is continuously evolving, and it’s crucial to recognize its limitations.
- Further Reading: Consider exploring resources like The Oxford Handbook of Computer Music Theory edited by David S. Worrall. Engaging with established scholars helps inform you about the latest developments in this exciting field.
Start your journey into AI-assisted musical exploration today. You never know what fascinating insights might await you just around the corner. Good luck!
FAQs About using AI visualization tools

DJ Scott Evans
Hey there! I’m Scott Evans, DJ and music tech enthusiast who’s gone all-in on AI music tools. After years behind the decks and geeking out over gear, I discovered how AI can unlock incredible creative possibilities for musicians like us. On this site, I break down complex AI music tech into easy-to-follow tutorials and honest reviews. Think of me as your friendly guide through the AI music revolution – no technical jargon, just practical tips to elevate your sound. Let’s explore what these digital tools can do for your creativity!